This tutorial was tested on
MatCalc version 6.04 rel 1.001
license: free
database: mc_fe.tdb
Click here to view the script for this tutorial.
This tutorial introduces the calculation of phase diagrams with an example featuring the well-known Fe-C binary system.
A phase diagram consists of a number of phase-boundaries separating regions of temperature- and composition-space in which different phases are stable at equilibrium. Published equilibrium diagrams for the Fe-C system often show equilibria between Fe-rich phases and both C (in the form of graphite) and cementite (Fe3C). Graphite is the more stable of these two phases, and forms readily in cast irons (2-4 wt.% C), but usually with great difficulty in steels (up to 1.5 wt.% C). In the latter, it is more practically useful to consider metastable equilibria involving Fe3C. In this tutorial, phase diagrams for both Fe-C and Fe-Fe3C will be calculated.
Create a new workspace file. From the 'mc_fe.tdb' database, select the elements FE and C and the phases LIQUID, BCC_A2, FCC_A1, CEMENTITE and GRAPHITE. Enter the composition 0.05 wt.% C. Create a new plot window of type p1 (X-Y data).
The phase diagrams will be calculated from 0 to 5 wt.% C, but the low carbon content of 0.05 wt.% C is chosen so that the lines bounding the high-temperature ('delta') ferrite phase, which is only stable at relatively low carbon contents, can be found.
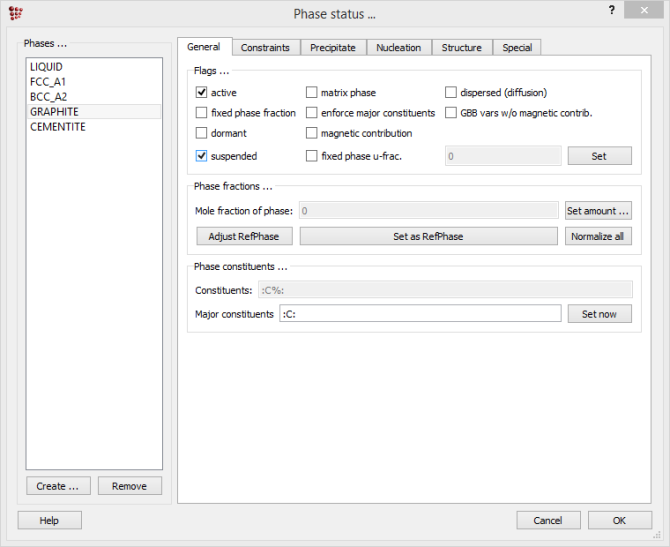
Firstly, the Fe-Fe3C diagram will be calculated, so it is necessary to suspend graphite, since it is more stable than Fe3C. Open 'Global > Phase status'. In the 'General' tab, put a tick-mark in the box beside 'suspended':

The phase diagram is made up of a number of phase boundaries. As was have seen in the last part of Tutorial 7, these boundaries can be found by finding a point on the boundary, then tracing the boundary as a function of element content. The method for tracing a boundary for phase 'X' is as follows:
Calculate an equilibrium at an appropriate temperature, near to the expected boundary temperature Find the 'X'-phase boundary by varying the temperature with 'X' as the target phasePerform a stepped calculation, varying the element content between selected limits, with 'X' as the target phase
Beginning at the high-temperature end of the diagram, the uppermost phase boundary at a composition of 0.05 wt.% C is between a single-phase liquid region and a liquid and delta-ferrite (BCC_A2) region. The first boundary which must be found is, therefore, a BCC_A2 phase boundary.
To locate the boundary, an equilibrium must first be calculated reasonably close to the expected boundary temperature. It can be seen that the line lies somewhere between 1538°C (the melting temperature of pure iron) and 1500°C. Click on the ![]() icon and enter the temperature '1530'. (If this gives an error message, select 'Calc > Set start values' then repeat the equilibrium calculation.) Then click on
icon and enter the temperature '1530'. (If this gives an error message, select 'Calc > Set start values' then repeat the equilibrium calculation.) Then click on  to open the 'Search phase boundary' window. Select 'Temperature' in the left-hand column and 'BCC_A2' as the target phase. The 'Output' window should show the following message:
Tsol 'BCC_A2': 1533.99 C (1807.14 K) iter: 8, time used: 0.03 s
![]()
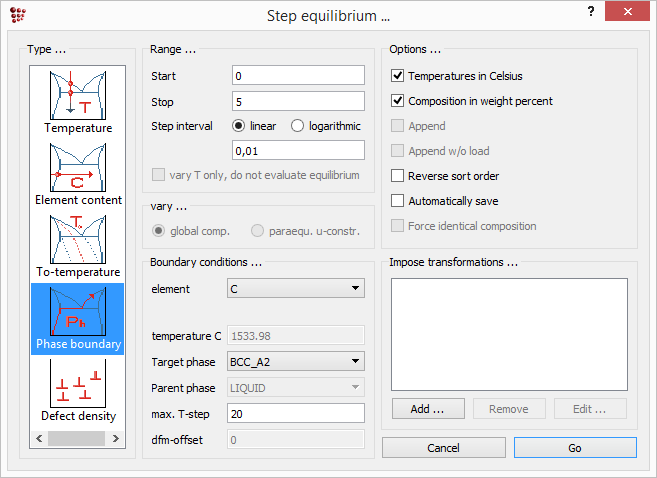
This shows that a point on the boundary has been found successfully. The next step is to trace this boundary using the stepped equilibrium function to vary the carbon content. Click on and choose 'Phase boundary' from the left-hand column. Enter the range: '0' to '5', in intervals of '0.01'. Select 'C' as the varying element and 'BCC_A2' as the target phase. Leave the 'Max T-step' value at its default value of '20'. In the 'Options' section of this window, check that 'Temperature in Celsius' and 'Composition in weight percent' are both selected. Click on 'Go' to launch the calculation.
The following message appears ; accept it with 'Yes'.

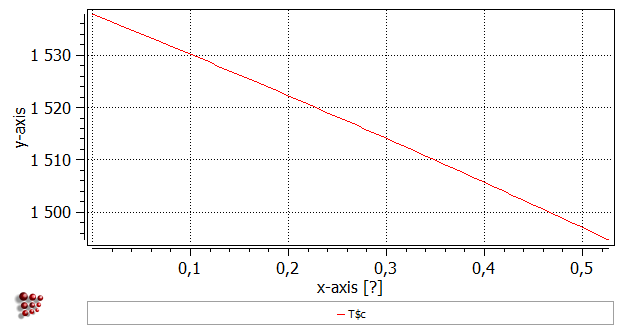
Now that the first phase boundary has been calculated, drag and drop 'T$C' from the 'Variables' window (where it can be found under 'favorites') to the plot. It is useful to add gridlines to the plot (With plot window selected, go to 'Options' window and in 'plots'>'plot#0'>'grid' select 'enabled' for 'major-x' and 'major-y'). Note that the x-axis currently only runs from zero to just over 0.5 wt.% C. From the point identified on the phase boundary, the calculation first proceeds in a direction of increasing carbon content. However, the BCC_A2 phase is not stable beyond approx 0.53 wt.% C, so the calculation (which cannot reach the stop limit of 5 wt.% C) stops and the 'Continue in other direction?' message shown above is displayed to ask whether the user wishes to complete the rest of the calculation, in which the carbon content is decreased from the point identified at 0.05 wt.% C to zero.
Right-click in the plot window outside the plot area itself, and select 'Duplicate and lock series' from the menu displayed. Select the name of the series and click 'Duplicate' to produce a copy of the series. In the 'options' window, rename the first series 'bcc_high_1'.
The next phase boundary encountered on decreasing the temperature is between the LIQUID + BCC_A2 region and the BCC_A2 single-phase region, so this is a LIQUID-phase boundary. 1500°C would appear to be a suitable temperature for the starting equilibrium to find this line. In the 'search phase boundary' box, select 'LIQUID'. The following line of output should appear:
Tsol 'LIQUID': 1515.44 C (1788.59 K) iter: 4, time used: 0.03 s
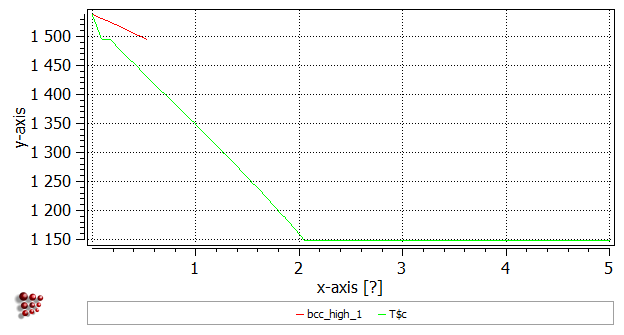
Then make a stepped calculation with the same start, stop and interval values and the target phase set to 'LIQUID'. (A start-value of zero is automatically changed by the program to '1e-12' to facilitate the calculation.) The diagram should now look like this:
Don't forget to duplicate and lock this new series!
Calculate an equilibrium at 1400°C, search for BCC_A2 (the boundary temperature should be 1429.61 C (1702.76 K)), step from 0 to 5 wt.% C with an interval of 0.01 wt.% C. Accept the 'Continue in other direction' message (the calculation could not reach 5 wt.% C limit, again) with 'Yes'.
Calculate an equilibrium at 1500°C, search for FCC_A1, step from 0 to 5 wt.% C with an interval of 0.01 wt.% C. The boundary temperature should be 1460.19 C (1733.34 K).
Calculate an equilibrium at 900°C, search for BCC_A2, step from 0 to 5 wt.% C with an interval of 0.01 wt.% C. The boundary temperature should be 888.65 C (1161.80 K). The image below shows how the diagram should look, with appropriate labels for the lines:
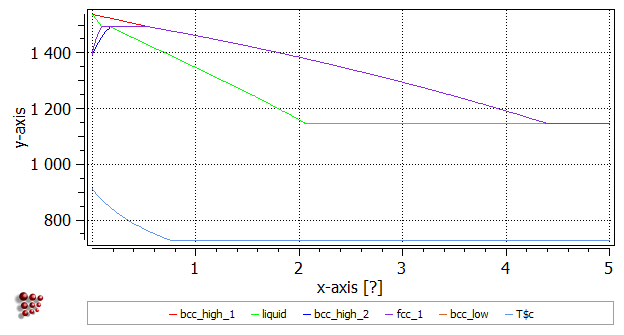
The most of the upper section is now done, with the exception of the phase boundary between LIQUID and LIQUID + CEMENTITE for hypereutectic compositions. This line is continuous with the cementite line between the FCC_A1 and FCC_A1 + CEMENTITE regions and the horizontal line between BCC_A2 + FCC_A1 and BCC_A2 + CEMENTITE regions, so it will appear when this line is calculated.
In the lower section, there is a very narrow alpha-ferrite single-phase region at low carbon contents. The upper part of this region is bounded by an FCC_A1 boundary, and the lower part of the region by a CEMENTITE boundary. Since these two boundaries are very steep, it is necessary to modify the calculation parameters. Failure to do this can lead to incorrectly calculated boundaries.
Calculate an equilibrium at 600°C then search for the FCC_A1 phase boundary, which should be at 726.53°C. Step from 0 to 5, with an increment of 0.001 instead of 0.01. This reduced increment makes the calculation rather more time-consuming; on a slow machine, it may be better to divide it into two parts: step from 0 to 0.02 with an increment of 0.001, duplicate and lock, step from 0.02 to 5 with an increment of 0.01.
Calculate an equilibrium at 800°C. Search for the CEMENTITE phase boundary; this also should be at 726.53°C. Using the same settings as for the previous stepped calculation, the phase boundary is calculated correctly, but might extend in the negative temperature direction beyond physically reasonable values. This occurs because the calculated boundary becomes increasingly steep as the carbon content approaches zero.
One way of removing the unwanted line portion is simply to modify the scaling of the y-axis. (The minimum temperatures given on equilibrium diagrams are typically 400-500°C, because it becomes difficult to attain equilibrium over practical timescales at low temperatures.) Another solution is to remove unwanted data points using 'Edit series data' from the right-click menu of the plot.
Alternatively, the 'overshoot' can be avoided by modifying the parameters of the stepped calculation. Increasing the 'max T-step' allows greater steps in temperature, enabling the program to cope with very steep boundaries. A suitable value is 100 or 200. Additionally, setting the starting value of the stepped calculation to a slightly higher value, for example 0.0005 instead of 1e-12, avoids the calculation of the steepest parts of the phase boundary. With these modified settings, a satisfactory appearance is obtained without the need to change the axis scalings or delete any points.
Following a phase boundary in the stepped calculation is performed by a simple procedure. Once an initial point is found with 'Search phase boundary' operation, the composition of the system is changed by a value specified as a step in the 'Range' section of 'Stepped equilibrium' window. For this new composition, MatCalc search a phase boundary in a temperature range (Told - 'max T-step' ; Told + 'max T-step'), where Told is a temperature of a phase boundary at a previous composition. If the phase boundary is too steep, no phase boundary would be found. In such a case MatCalc changes a variable from the element content to the temperature (this is indicated by the message 'changing independent variable to temperature' in the 'Output' window). In effect, the temperature will be varied by a step equal to the value of 'max T-step' parameter and MatCalc will look for the phase boundary at that temperature. In some cases, this might result with the wrong equilibria, especially when the stoichiometric compounds are the equlibrium phases (due to the undefined chemical potentials for these phases)
Do not forget to lock the last series to be added, so that it is not modified when another calculation is performed. Add axis labels and a title 'Fe-Fe3C phase diagram'. The subscript can be obtained using HTML tags:
Fe-Fe3C phase diagram
The finished phase diagram should look like this; compare with the sketch below to verify that all the lines have been calculated correctly.
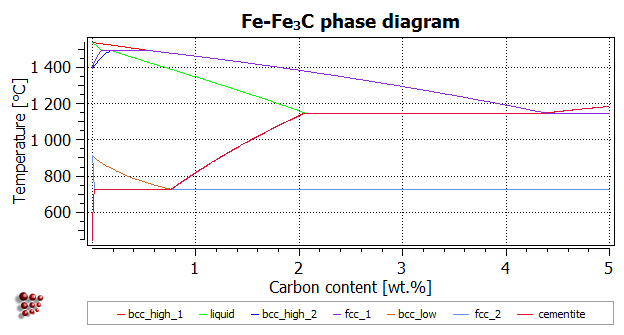
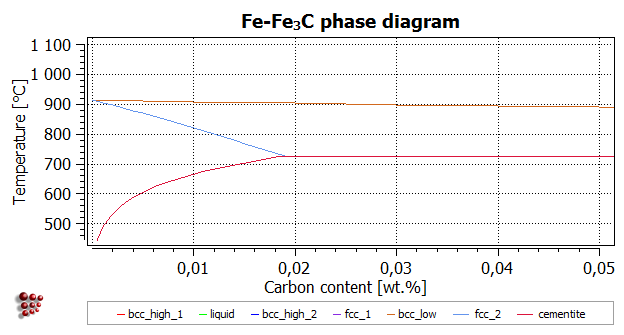
The image below shows an expanded version of the low-C region presenting the phase solubility of alpha-ferrite.
Set up this system by removing the 'suspended' flag for GRAPHITE under 'Global > Phase status > General'.
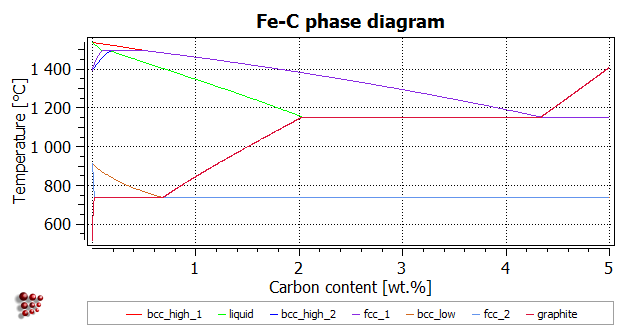
The calculation of the Fe-C diagram is left as an exercise to allow the user to familiarise him- or herself with the method, including the choice of appropriate values for the starting equilibrium calculation temperatures and the calculation parameters. However, suggestions are given at the foot of the page. The diagram below shows how the finished diagram should look. (Alternatively, the phase boundaries from the Fe-C calculations can be superposed on the Fe-Fe3C phase diagram for comparison.)
- Upper boundary of high-T bcc: Equilibrium at 1550°C (Tsol 'BCC_A2': 1533.99°C); step from 0 to 5 with interval of 0.01, max T-step 20
Lower boundary of liquid: Equilibrium at 1500°C (Tsol 'LIQUID': 1515.44°C); step with same parameters
Lower boundary of high-T bcc: Equilibrium at 1400°C (Tsol 'BCC_A2': 1429.61°C); same parameters Upper boundary of fcc: Equilibrium at 1500°C (Tsol 'FCC_A1': 1460.19°C); same parameters Upper boundary of low-T bcc: Equilibrium at 900°C (Tsol 'BCC_A2': 888.65°C); same parametersLower boundary of fcc: Equilibrium at 700°C (Tsol 'FCC_A1': 738.03°C). For this line, the parameters must be modified: decrease the interval to 0.001 or increase the T-step to 200. The latter solution (an interval of 0.01 and a T-step of 200) is acceptable because this boundary is a straight line so is correctly defined despite there being only a few points in this region. An error message (max no of iterations reached) may appear, but the line is calculated successfully.
Upper boundary of graphite: Equilibrium at 800°C (Tsol 'GRAPHITE': 738.03°C). If problems occur, decrease the interval to 0.001 as well as increasing the T-step to 100 to obtain better resolution of the phase boundary curvature. This boundary, like the cementite boundary discussed above, tends to 'overshoot' to very low temperature values. This can be prevented by setting the minimum carbon content for the stepped calculation to 0.0005 instead of 1e-12.